Today we talked about misleading graphs:
Tonight's homework is to find and cut out or instagram a pic (or more) of a graph. Ideally it would be a misleading graph, but any graph will do. If you instagram your graph, please hashtag it #misskgraphs
Here are some examples I found online, see if you can determine what is wrong with them...
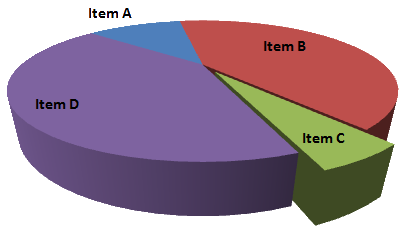
Teeny, tiny Item A, but is it any smaller than Item C?

We were REALLY low in '32 and '33. But was it practically zero?
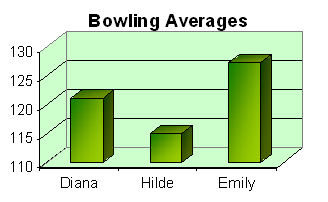
Emily is sooooo much better than Hilde, or is she?

Ahhhhh, perspective...

Look below to see why the candy corn graph is bad!


Is the change really that dramatic in this rainfall graph?

(Same graph in figures 7 and 8. Which one is better?)
I can't wait to see what you find! (Hopefully on Thursday!)
-Miss K :)
No comments:
Post a Comment